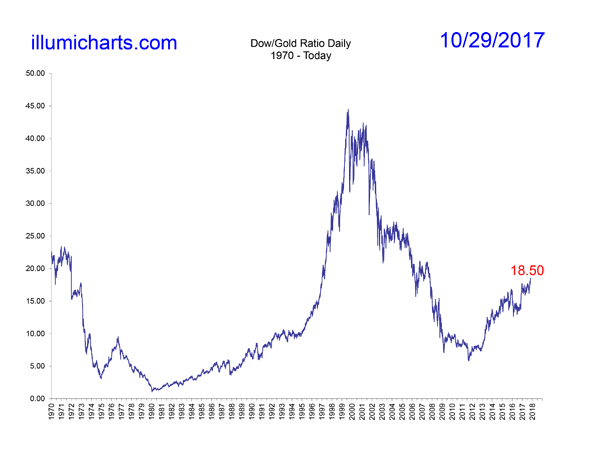
The Dow/Gold Zoom
This chart is updated every Saturday.
This collection of 6 charts is a short-term to long-term view of the Dow/Gold Ratio. It shows the business cycle in daily 6 month, daily 1 year, daily 2 year, daily 5 year, daily 1973 to present, and yearly 1896 to present views. When you "zoom" in and out of the chart you can clearly see the effects of monetary inflation on the economy. You will notice that the since the Dow Jones Industrial Average began in 1896 there have been three cycles; we are currently experiencing the third.
The Dow/Gold Ratio is created by taking the Dow Jones Industrial Average in dollars and dividing it by the price of gold in dollars. The dollars cancel out leaving what amounts to the Dow Jones Industrial Average priced in gold ounces instead of paper currency. Why would we want to do this? One reason is that we know about how much new gold is mined every year and so in terms of gold we know how much inflation is happening and comparitively, it is low enough for us to ignore it. Paper currencies are inflated at a much higher rate and this inflation causes dislocations in the market. (Imagine a counterfeiter producing a million dollars in his basement and going out and buying things with it. What would happen to the prices of the things he buys?) These dislocations in the market must eventually be corrected. And this is what we can see quite clearly when we price the general markets, in this case the Dow index, in gold.
Analyzing the yearly Dow/Gold Ratio over the long term makes it easy to see that the current "hump" or cycle looks much more like the cycle that occurred from about 1921 to about 1933 than it does the cycle that occurred in the 60's and 70's. One explanation for why this might be has to do with the way the Fed controlled the money supply at the tme. Up until 1973 the price of gold was "fixed" in terms of dollars. In other words, a foreign country could return dollars to US in exchange for gold at a fixed ratio. When a country inflates it's money suppy while a gold standard is in effect begins the process of losing all of its gold. So in 1973 the gold exchange standard was abandoned and the gold price was free to adjust to economic changes.
During the 1921-1933 cycle gold was also fixed and it remained so for the entire cycle. IThe Dow index therefore took the brunt of the correction, since the price of gold could not change. In the current cycle, there is no gold standard or gold-exchange standard and the price of gold moves relatively freely. The ratio therefore is made up of a mix of both changes to the price of the Dow as well as the price of gold.
The Dow/Gold Ratio has hit two previous cycle lows and three previous cycle highs. In September 1929 it hit a high of 18.48, followed by a low of 1.91 in February 1933. The next high occurred in February 1966 at 28.33 with a following low of 1.05 in January of 1980. The current cycle peaked in August of 1999 at 44.51.
For the sake of speculation, calculating a loose proportion between the 1921-1933 humps and the current hump as they appear in yearly averages, gives us a possible date for the ratio low. See the charts How High Gold and How High Gold 2012 for more information.
Data for the price of gold comes from the daily London Fix and is available on Kitco's website. Data for the Dow can be found at Yahoo! Finance.

