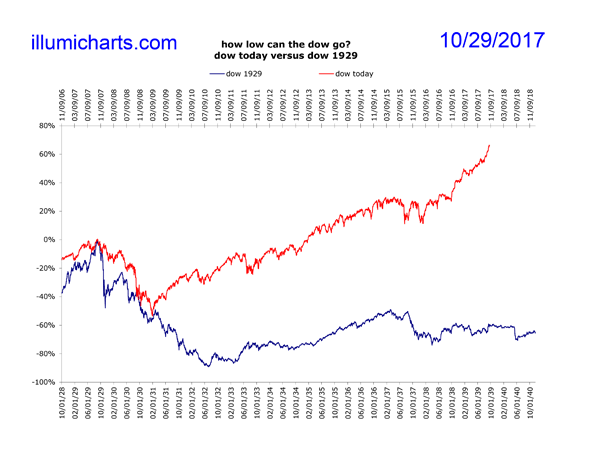
How Low Can the Dow Go?
This chart is updated every Saturday.
This chart shows a comparison between the Dow Jones Industrial Average October 1928 to October 1935 and the Dow Jones Industrial Average 2006 to present. It was created by overlaying the Dow highs in 1929 and 2007 and letting the rest of chart develop from there. The Dow fell a staggering 90% from its 1929 high, but the 2008 crash bottomed at only about 50%. Why? This has to do with the fact that in the 20's and 30's the dollar was pegged to a certain quantity of gold and therefore dollars could not be printed without the country losing gold. The correction, therefore, had to be absorbed entirely by the market.
Make no mistake though. Just because the Dow price looks better now, its fall in real terms is just as big. See the Dow/Gold Zoom for more information.
Data for the Dow can be found at Yahoo! Finance.

